There is a particular kind of debugging session that every developer using EF Core knows.
The page is slow, not broken, and not throwing a helpful exception. Just slow enough that you can feel it every time you click.
So you start asking the usual questions.
Is it the database? Is it the query? Is it an accidental Include() party? Did lazy loading wander into a loop and quietly turn one request into fifty-seven round-trip requests? Is this endpoint slow because of one bad query, or because a lot of technically fine queries are stacked on top of each other?
Eventually, you get there. You turn on logging. You dig through SQL output. You add timing and reproduce the request. You scroll. You squint. You copy a query into SSMS, and you find the problem.
The whole process has always felt a little too manual for me, which is why I built EFCoreDiagnostics.
EFCoreDiagnostics is a development-time diagnostics and profiling library for Entity Framework Core. It plugs into your DbContext, watches the SQL that EF Core is already executing, analyzes it for common performance problems, and gives you a live dashboard so you can see what your app is doing while it’s doing it.
My goal was not to build a full APM platform. The goal was much more practical than that: Give my dev team a fast, local, understandable way to answer, “What did EF Core just do, and should I be worried about it?”
What EFCoreDiagnostics Provides
At the 50,000 foot level, EFCoreDiagnostics gives you a few things I kept wanting during normal app development:
- real-time query monitoring
- slow query detection
- N+1 query detection
- query fingerprinting and aggregate statistics
- EF Core best-practice warnings
- database connection tracking
- a live dashboard powered by SignalR
- an analyzer model that can be extended with custom rules
You install it, register the services, attach the interceptors to your DbContext, and map the dashboard:
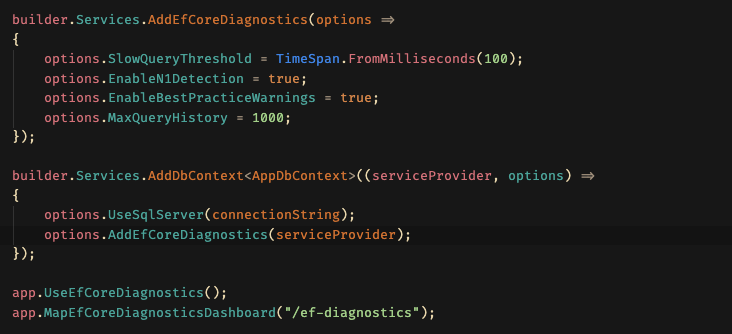
Then open /ef-diagnostics and watch your application from the database point of view.
The Architecture
The architecture of EFCoreDiagnostics is intentionally small:
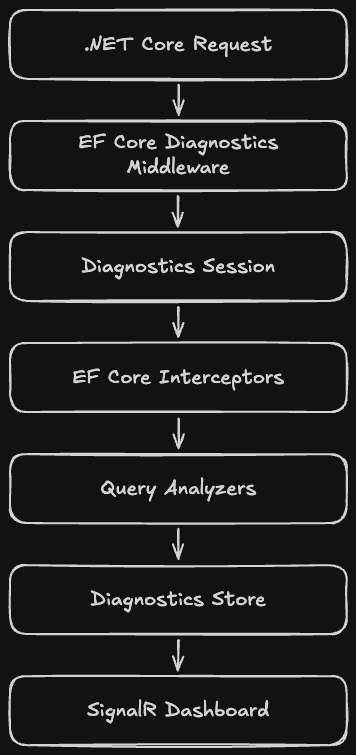
There are three main layers:
- The capture layer, where EF Core interceptors observe commands and connections.
- The analysis layer, where queries are fingerprinted and inspected.
- The presentation layer, where recent queries, sessions, warnings, and statistics are exposed through APIs and pushed to the dashboard via SignalR.
That separation is the important part. The interceptors do the minimum needed to capture what happened. The analyzers decide whether it matters. The store and dashboard make the results visible.
Capturing Queries with EF Core Interceptors
EF Core already gives us the cleanest integration point via interceptors.
EFCoreDiagnostics uses a DbCommandInterceptor to hook into command execution. It tracks reader, scalar, and non-query commands, both sync and async. When a command starts, the library creates a QueryExecution object with the SQL, command type, parameters, connection ID, start time, and normalized fingerprint.
When the command completes, the interceptor records the duration, success state, row count when available, error message if the command failed, and whether the query crossed the configured slow-query threshold.
That QueryExecution becomes the central unit of the system. It is the little case file for one database operation:
- what SQL ran
- when it started
- how long it took
- whether it succeeded
- which request it belonged to
- what parameters were present
- what analyzers had to say about it
There is also a DbConnectionInterceptor for tracking connection lifecycle events. It records when connections open and close, keeps current connection statistics, and warns when a connection stays open longer than the configured leak threshold.
Again, this is development tooling. You want visibility, but you also want to keep the surface area understandable.
Request-Scoped Diagnostics with AsyncLocal
One of the trickier parts of diagnosing EF Core behavior is that a single slow page is rarely just one query. It is a request.
That request may call a controller, which calls a service, which calls a repository, which executes several LINQ queries, which may trigger lazy loading somewhere else. If you only look at individual SQL commands, you miss the shape of the whole request.
EFCoreDiagnostics handles that with DiagnosticSession
The middleware creates a new diagnostic session at the beginning of each HTTP request and stores it in an AsyncLocal<DiagnosticSession?>. That gives the EF Core interceptors access to the current request context without forcing application code to pass a diagnostics object around.
So when a query completes, the interceptor can say, “Here is the SQL. Here is the duration. Also, this came from GET /order/report.”
That request context is what makes N+1 detection possible. Is is not enough to know that the same query pattern happened many times. You need to know it happened many times inside the same request.
Query Fingerprinting
Raw SQL is noisy.
These two queries are different strings:
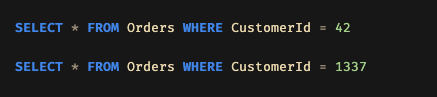
But diagnostically, they are the same shape. EFCoreDiagnostics normalizes SQL into fingerprints by replacing literal values, parameter names, GUIDs, numeric values, and repeated IN clause values with placeholders. It also normalizes whitespace and casing.
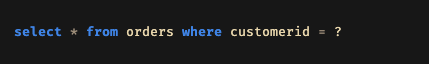
That means the system can group similar queries together:
This unlocks a lot:
- repeated query detection
- per-fingerprint timing statistics
- N+1 analysis
- “which query shape costs us the most total time?” reporting
The fingerprint is not trying to be a SQL parser. It is a pragmatic pattern matcher. For diagnostics, that is usually the right trade.
The Analyzer Model
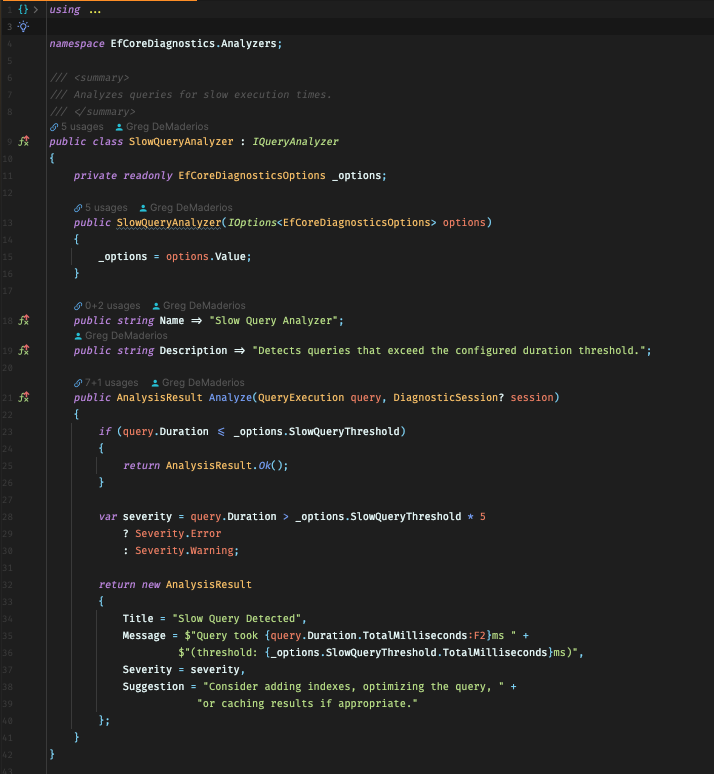
Once a query has been captured and fingerprinted, EFCoreDiagnostics runs it through analyzers.
The analyzers wired into the default diagnostics pipeline are:
SlowQueryAnalyzerN1QueryAnalyzerBestPracticesAnalyzer
There is also a LargeResultSetAnalyzer implementation in the codebase for row-count-based checks when that data is available, but the main default path focuses on the first three.
The slow query analyzer is straightforward. If a query exceeds the configured threshold, it gets flagged. If it is significantly over the threshold, the severity escalates.
The N+1 analyzer is more interesting. It looks at the current DiagnosticSession, counts how many times the same fingerprint has appeared, and flags the request once the count reaches the configured threshold.
That catches the classic pattern:
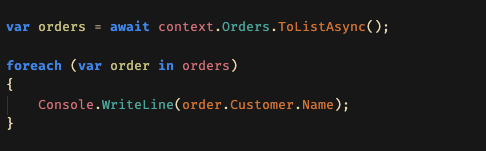
One query gets the orders. Then, each navigation property access quietly requests another customer from the database. The app works, and the page loads. Everything is technically fine, except the database is now doing the small, repetitive work that a single intentional query should have handled.
The best-practices analyzer looks for common SQL-level code smells:
SELECT *- unbounded queries
- multiple joins that may indicate a cartesian product
- leading wildcard
LIKEpatterns - potentially non-parameterized SQL
- large result sets when row-count information is available
That point is not that every warning is automatically a bug, but rather, that these are places where a developer should probably look twice.
Extensibility: Bring Your Own Rules
Every application is different and every application has its own version of ‘suspicious’.
Maybe a certain table should never be queried without a tenanct id. Maybe reporting queries above a certain duration are fine, but checkout queries are not. Maybe your team has a rule about projections, split queries, or soft-delete filters.
EFCoreDiagnostics has a small analyzer contract for that:
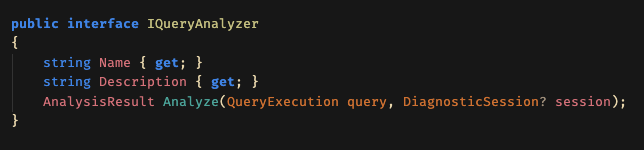
That is the execution point. You get the query, you get the current request session if one exists, and you return an AnalysisResult.
Then you register it:
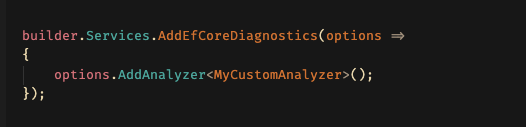
I like this style because it keeps the core package opinionated but not closed. The built-in rules cover the usual suspects. Custom analyzers let a team encode the things they have learned the hard way.
The In-Memory Store
EFCoreDiagnostics uses an in-memory DiagnosticStore for recent query history, session history, aggregate statistics, and detected N+1 patterns.
The store is thread-safe and bounded. Recent queries are kept in a concurrent queue and trimmed based on MaxQueryHistory. Session history is also bounded. Query statistics are grouped by fingerprint so you can see execution counts, total duration, minimum duration, maximum duration, average duration, and last execution time.
This was another deliberate choice. For local debugging, I do not want to provision storage. I do not want diagnostic data to become another dependency. I want to run the app, exercise a page, see what happened, clear the data, and keep moving.
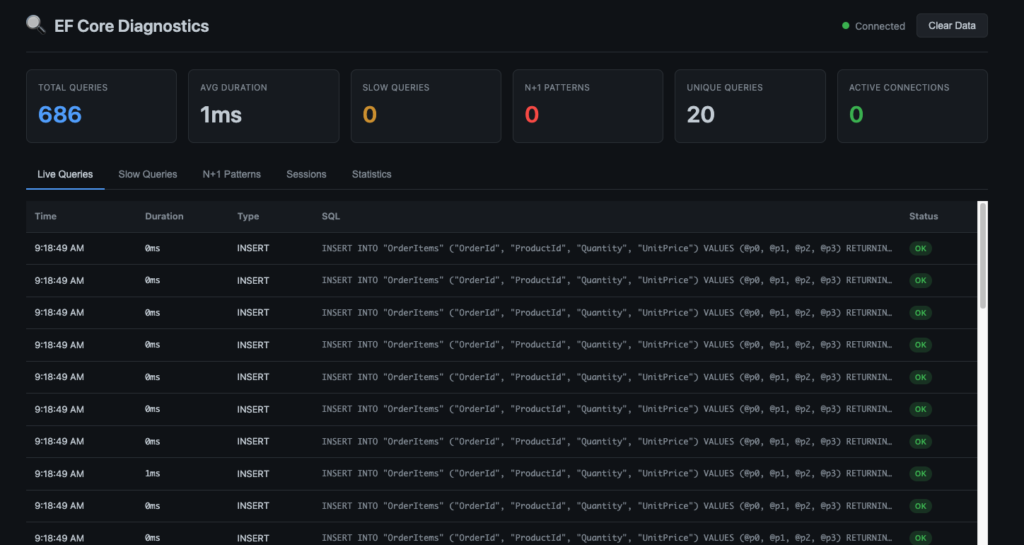
The Dashboard
The dashboard sits on top of the same data model.
There are REST endpoints for things like:
- overall statistics
- recent queries
- slow queries
- recent sessions
- query statistics
- N+1 patterns
- connection status
- clearing collected data
SignalR adds the live part. When queries execute, sessions complete, connections open or close, or an N+1 pattern is detected, the dashboard can update immediately.
That real-time feedback loop matters more than it sounds like it should.
There is a difference between reading a log after the fact and clicking around your app while queries are displayed. The second one builds intuition. You start to feel pages are chatty. You notice when one action does more database work than expected. You see repeated fingerprints stacking up and think, “Ah, there it is…”
That is the kind of debugging flow this project is built around
What This Is Not
EFCoreDiagnostics is not meant to be left enabled in production.
Interceptors add overhead. Capturing command text, parameters, timings, stack traces, and analysis results is useful, but it is not free. The README is intentionally blunt about this – wrap it in development environment checks:
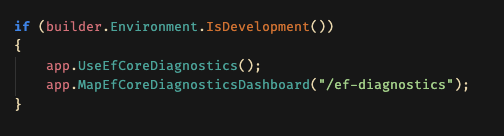
There are cases where production diagnostics make sense, but that is a different product shape. This one is optimized for the developer loop: reproduce, observe, understand, fix.
Why I Built It This Way
The easiest version of this library would have been “log every query and call it a day.” But logs are only part of the answer. The thing I wanted was context and a pretty dashboard!
That is why the architecture has sessions, fingerprints, analyzers, and a dashboard. Each piece adds one layer of meaning to the raw EF Core events.
EF Core gives us hooks. .NET Core gives us the middleware pipeline. SignalR gives us the live updates. EFCoreDiagnostics ties those together into a tool that makes database behavior easier to see.
Comments